


The second rule we want you to get familiar with is the following: “Who knows all the answers, has not been asked all the questions” which is a quote of Confucius, a Chinese philosopher and politician who gifted us with real pearls of wisdom. Confucius left no written works of his own, his teachings are, however, collected in the “Analects of Confucius”, a collection of fragments of conversations and anecdotes between the philosopher himself and his early disciples.
By interpreting his words, we may understand that it is almost impossible to have answers to all the questions possible and, if you think so, probably is because you have stopped ask yourself those questions.
We may also say that in the very moment you stop asking yourself questions, you are done growing and improving. In other words, if you want to continuously develop and progress, you must be curious!
Curiosity and questions are fundamental aspects of a good Data Visualization. We saw the importance of asking questions in the first of our notebooks, entitled The Magic of Design in Data Visualization, here instead we want to focus on specific questions concerning our graphics and representations and their goals.
What is Data Visualization?
Data Visualization can be defined as the process of representing data by means of graphics. It can be seen as a powerful tool of discovery, whose purpose is to represent data in a way that exploits visual perception to amplify cognition.
It is important to notice that representing data graphically does not mean simplifying them but allowing users to see them under a different light, to observe patterns and exceptions and to discover stories that may be hiding behind the raw data. Data Visualization helps making data more accessible, understandable, and usable. Thus, the goal is to communicate information clearly and efficiently to users.
Even though its roots may be found in Descriptive Statistics, its use may be of interest for many different professions and jobs. Anyone who is interested in showing data in a more intuitive and familiar way to some audience may want to know how to achieve its purpose in the most effective way.
The importance of good questions
Data visualisation, indeed, offers answers to questions you didn’t know you had.
When you decide to represent data graphically, it is tempting to start with the visualisation straight away, but before you dive into the practicalities, you need to take the time to understand the purpose of the work you are approaching. Before you understand how to do a proper data visualisation, you need to understand what you want to communicate and why.
On the one hand, through a graphic or a representation, you may be able to offer several information, very different and broad but, on the other hand, this may lead to confusion for your audience. Thus, a successful data visualisation requires a solid definition of the questions you want to try to answer through the visualisation itself.
In order to help you understanding how to put this rule into practice, we suggest a few steps to follow:

Figure 1. Step to follow.
With the first three steps we want you to precisely define the goal of your work, the reasons you are doing it and to write down the questions to be answered. In this way you are “forced” to focus on these aspects and not to be vague on them. In addition, by putting everything in writing, you will know precisely what to improve in subsequent improvement interactions and you will not risk confusion or forgetting what has already been done.
Regarding the last point instead, we want to emphasize that offering the user all the available data can be counterproductive, a good visualisation uses a limited and selected amount of information, just because you have a lot of data doesn’t mean you need to use it all.
To summarise, when you want to produce a good visualization, or you are asked to, and you feel the uncontrollable desire to get your hands on practical tools, just stop for a moment and take the time to:
- write down what are you going to show to you audience and why;
- define which is the information you are going to give them in order to enable them to respond to some questions you already think of.
But let’s get our hands dirty!
Do you remember the graph we show you in the previous notebook? (If you don’t, take a look at Figure 2)
As we said, it is an example of a bad representation, carrying several mistakes. Some of them relate precisely to information overload. This example shows a clear surplus of information for its audience, indeed it isn’t clear what we wanted to show, to which questions we were trying to answer, which information we wanted to give in order to analyse the phenomenon described.
Take a closer look:
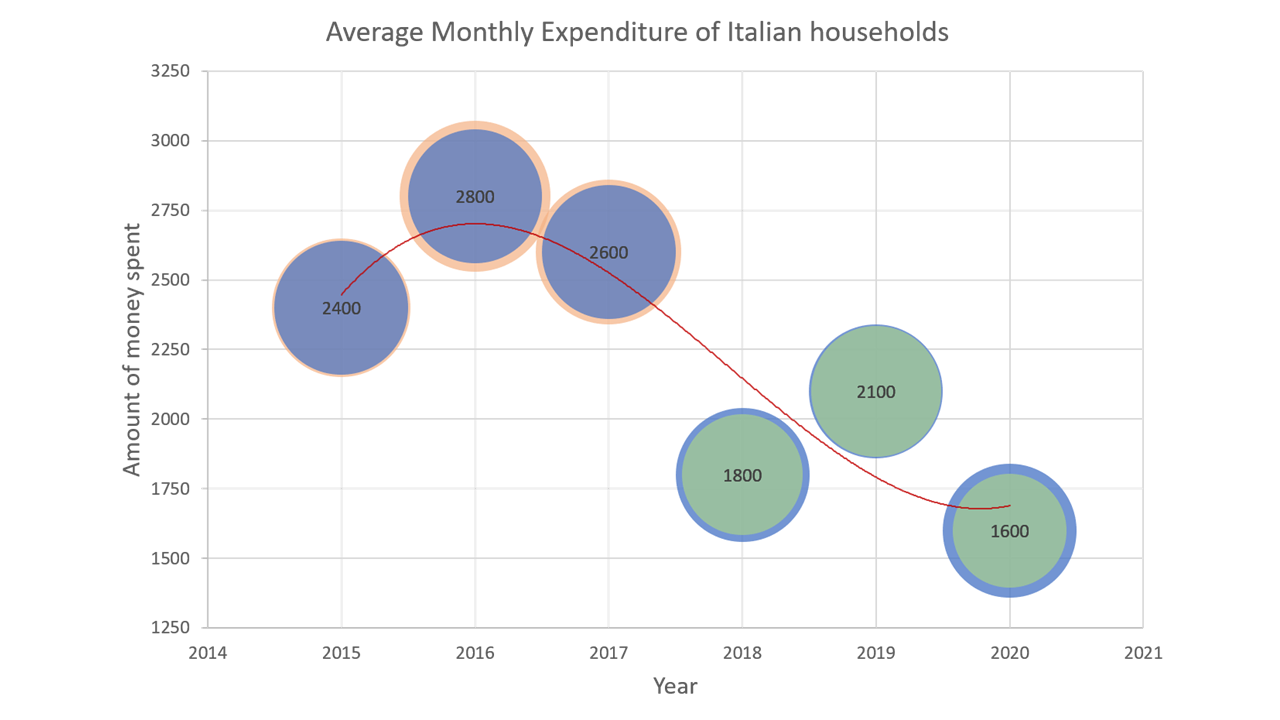
Figure 2. Example of a bad Data Visualization. Note: Data used in the graph are fictitious and created for illustrative purposes only.
Following the scheme suggested in Figure 1 we can clarify and improve our representation:
- Define the goal of your visualization. In our example it is possible to detect two different goals: (1) to show our audience the trend over time of the phenomenon concerning Italian households’ expenditures and (2) to suggest the idea of the variation in the magnitude of expenditure, letting our audience’ eyes do their amazing job, rapidly interpreting simple forms.
- Define the reason of your visualisation. This second step wanted us to focus on the deeper reasons why we chose to produce this representation. In particular, the reasons that might underlie the decision to show such a graph may depend on and change according to different aspects, for example our profession. Let’s pretend we work for a company that produces non-essential products, such as toys. In this particular case, one of the possible reasons for choosing such a representation may be to look for and highlight a correlation between our sales performance and household expenditure over time.
- Write a list of questions to be answered by the representation. This step is fundamental to clarify and synthesise our intentions and try to make them tangible. Keeping the previous example, we may have written the following questions:
- “How the expenditure of Italian households changed in magnitude?”
- “What time trend followed the average monthly expenditure of Italian households?”
- “Is there any similarity between the trend in overall spending and toy sales over the years?”
- “It is possible to assume that our sales values have been influenced by the variation in expenditure over time?”
- Be selective. After establishing the goals, the reasons, and the questions to be answered, it is essential to select only the necessary information to be included in the graph. As we said, including too much information in the same representation can be useless and counterproductive. In our case, it would have been useful to separate the goals into two different graphs, one including only the information relating to the change in expenditure over time, so that it could be compared with the change in the company’s sales over time, and one including only an intuitive visualization of the changes in magnitude.
After conducting the abovementioned steps, we can now show you some examples of solutions that fits better with our purposes:
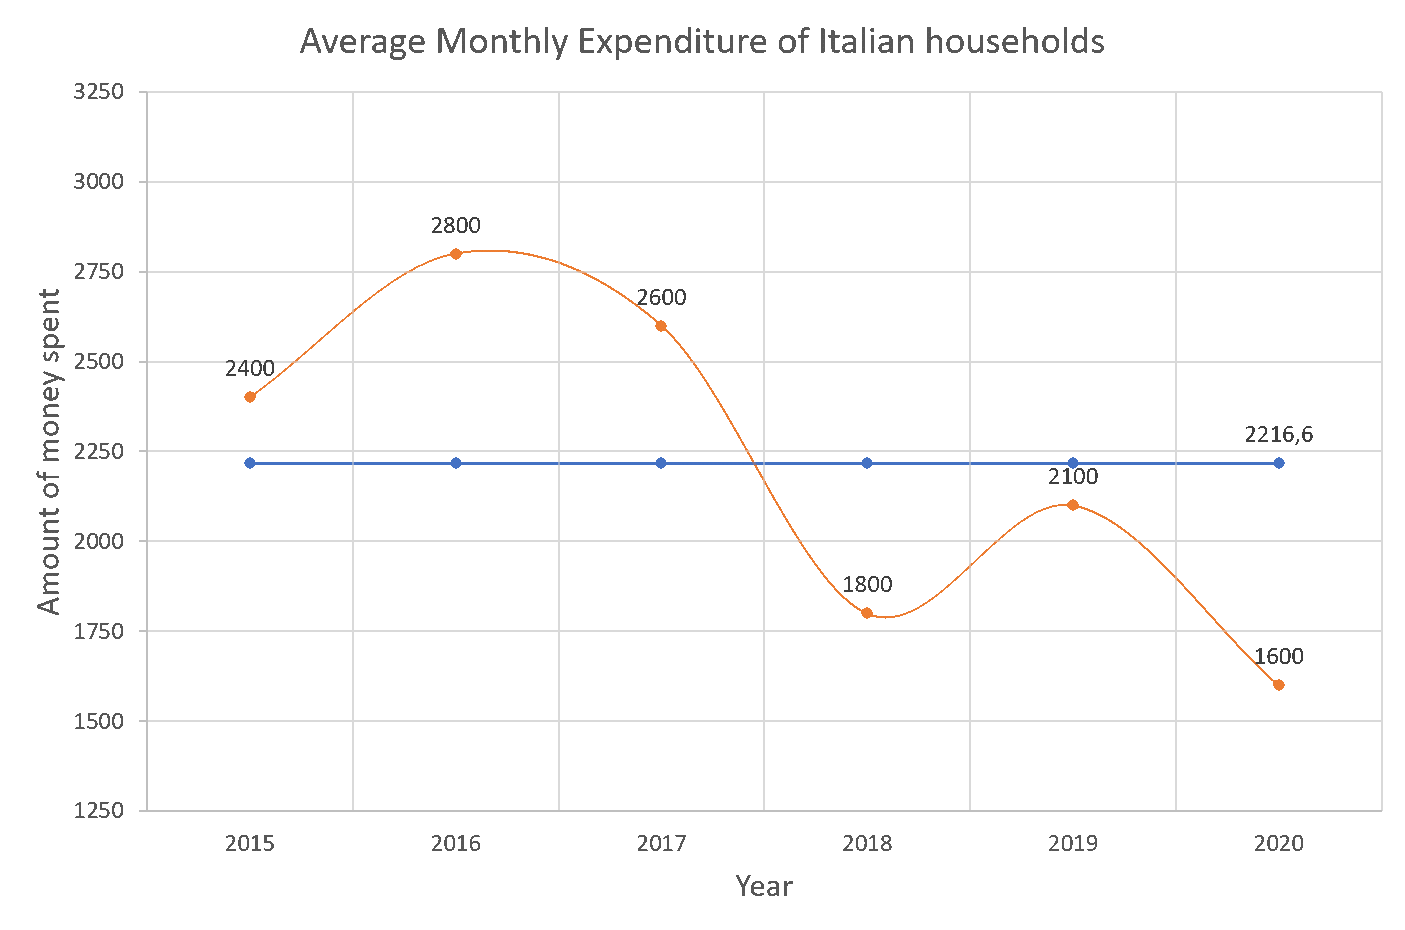
Figure 3. Line chart.
Or alternatively:
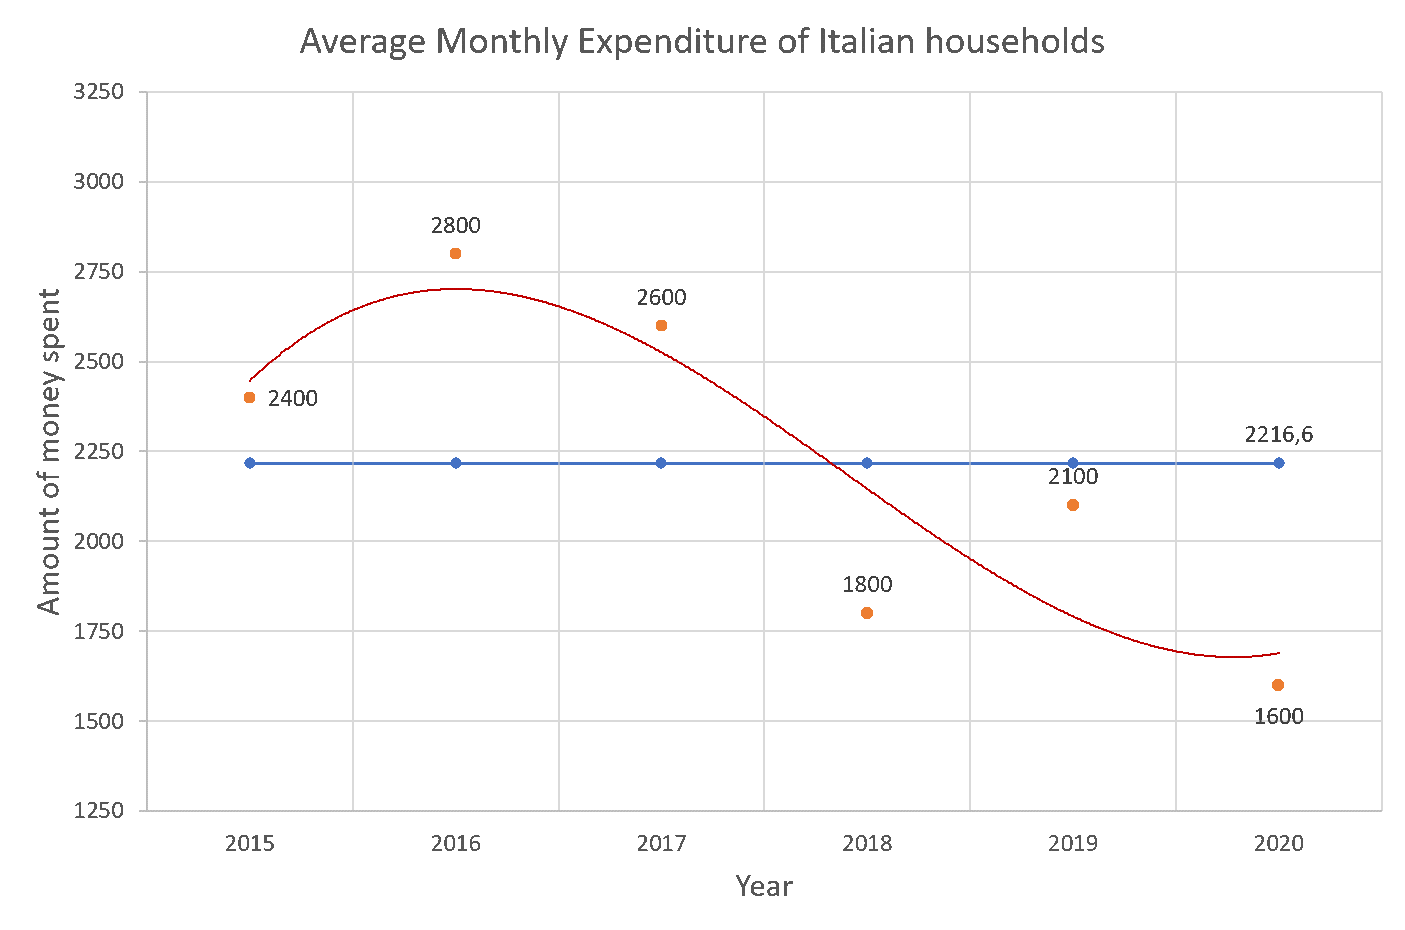
Figure 4. Line chart with trend approximation.
And lastly:
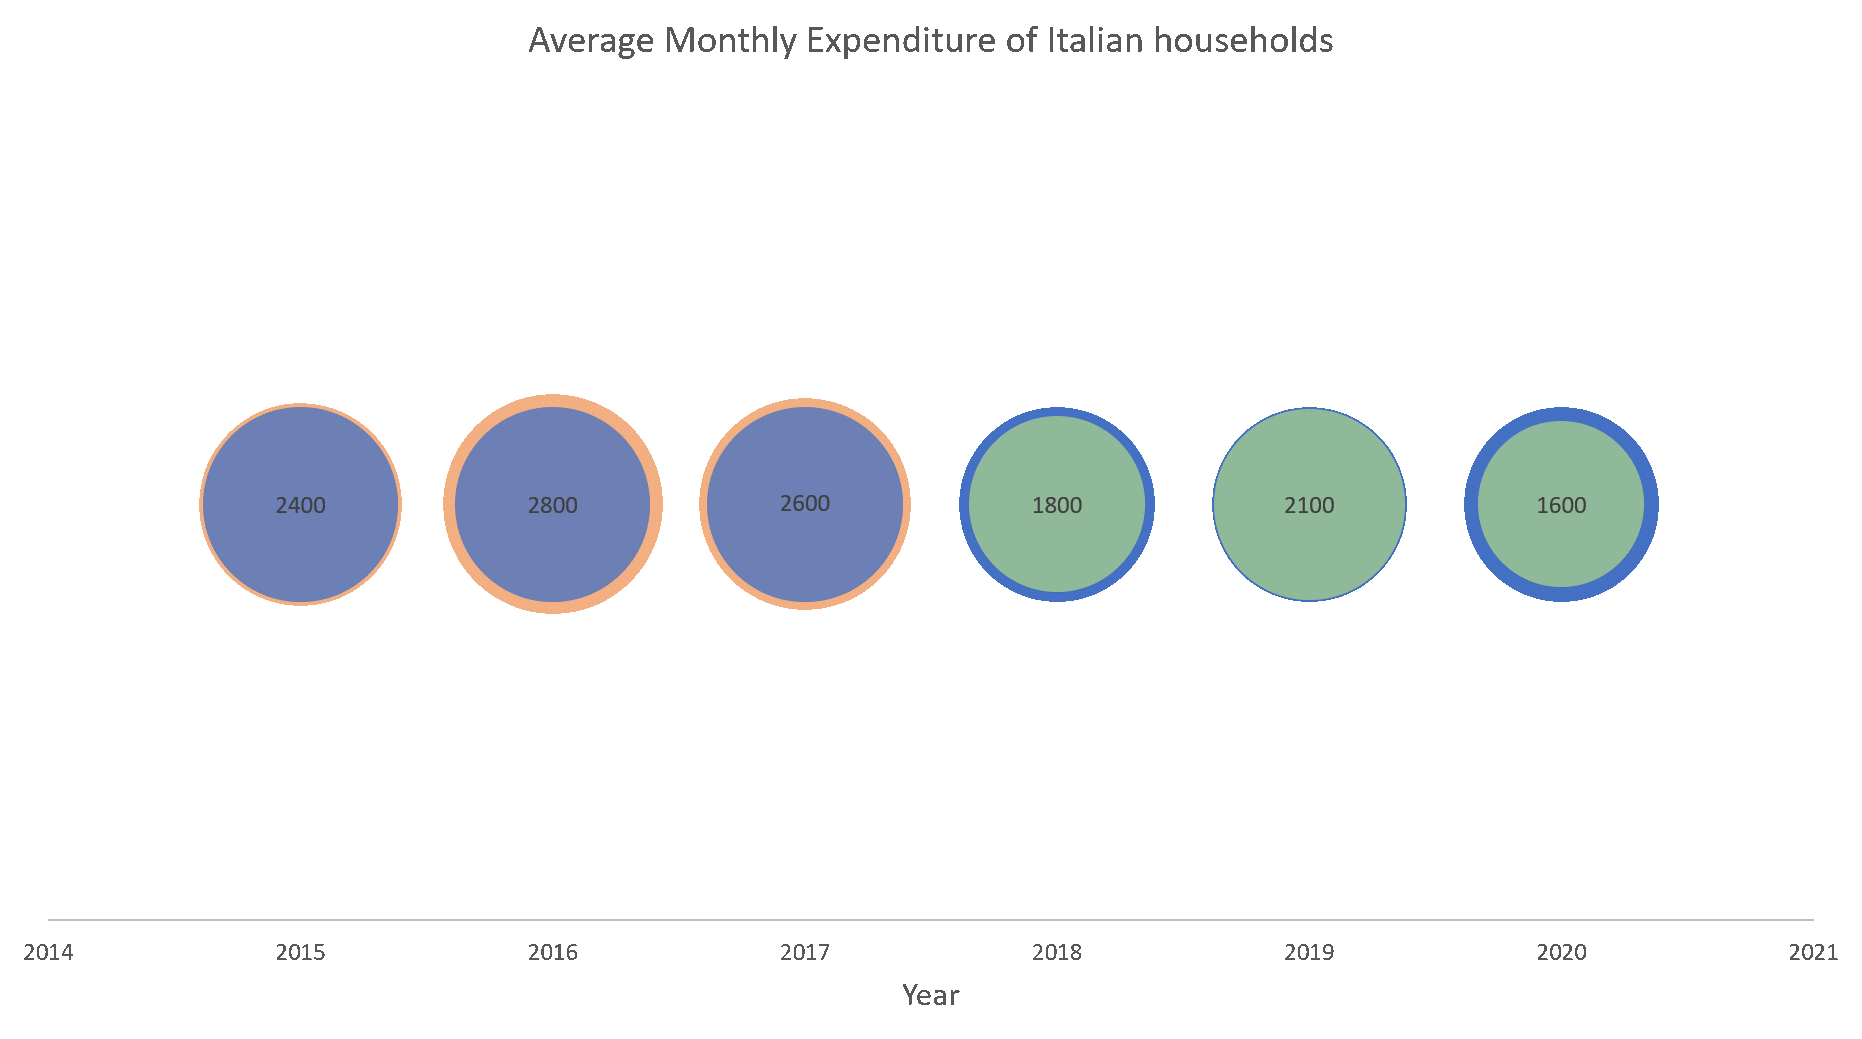
What it is important to notice is that goals, reasons, and questions must fit our specific cases, as we said in the previous notebook, the perfect solution doesn’t exist, that is also because of the number of alternatives and specificity that may occur.
Besides, the examples above are just some of the possible improvements we may make on this representation and it is important to notice that these examples themselves still carry mistakes with them. But since we don’t want to spoiler everything immediately, we will tell you more in the next notebooks!
In the future notebooks we will continue our adventures in designing Data Visualization output. The next article will focus on study of your consumers for communicating the right thing in the right way, namely “Think like a reader, not a designer.”
By Valentina Sale, Filippo Chiarello e Vito Giordano